Manage your Agile developement at all levels
With this module, you can:
- organize your user stories
- view the business value progress statistics
- view the statistics of the efforts deployed
- plan your product release using a roadmap
- manage the progress of your features”
LIST VIEW FOR A DAILY MANAGEMENT ADAPTED TO YOUR SPECIFIC STRUCTURE
In Scrum, user stories are typically grouped under epics. Certain teams group their epics under themes when they need more classification.
In its Agile portfolio white paper, Microsoft proposes to group product backlog items (PBIs) under features, which, in turn, are grouped under initiatives. The portfolio is therefore composed of both features and initiatives.
The Scaled Agile Framework (SAFe) groups user stories under features, which are then grouped under epics. Epics represent SAFe’s portfolio level.
The Product Management add-on offered by Urban Turtle can be adapted to fit all these realities. It gives you the opportunity to easily prioritize and manage your epics and your features.
PLAN YOUR DEVELOPMENT USING THE ROADMAP.
By clicking on the calendar icon on a feature, you can set its start date and end date. For the sake of planning, it is best to set an end date that matches the date at which you expect to release the feature to your end users.
You can also see all of your epics and features in a calendar. It is a nice way to have a clear and accurate vision of your product and project release planning. This calendar also gives you the opportunity to show the dependencies between the different elements and make sure that all releases are well planned.

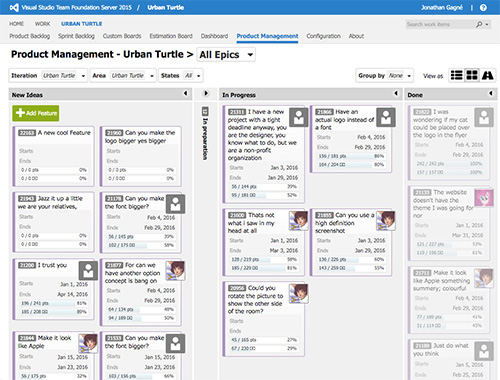
SEE YOUR FEATURES’ PROGRESS IN A GLANCE.
The 100% configurable feature management board allows you to show and manage the progress of your features. Adapt the columns to reflect your workflow and map the status of your features to have a realistic vision of your features that are in progress, in preparation, and done.
Use the different filters to group your features by epics, by team members, by areas or by iterations. The filters are an easy way to bring out certain elements during your presentations and they may help you with decision making.

STATISTICS ON PROGRESS
You can see the progress of each feature in terms of business value and effort.
To display the progress of a feature’s work items in terms of effort and business value, hold the mouse pointer over its progress bar.A tooltip containing more details on current progress is displayed. The statistics are available for all product management view modes.
BUSINESS VALUE, THE MOST IMPORTANT DATA!
To determine what constitutes valuable software, Product Owners need to think about what really brings value to their clients. Either they calculate the return on investment (ROI) of each story or compare the value of each story using the T-shirt sizing technique. One thing is sure, today, there is no standard formula for measuring value.
You will find a lot of information regarding the business value and the progress of your product in the Product Management view.
At the feature level, progress can be viewed regarding its business value and the efforts deployed.
Remember, the goal here is not to deliver 100% of the stories. At some point, you need to ask yourself (and evaluate) if it is necessary to execute remaining stories (development cost vs. value provided to clients).