Monitoring a project's progress while following its scope with the Sunset Graph
 Scrum is a relatively simple framework to work with, and many teams are taking advantage of it. Agile practices bring a lot of transparency and visibility, but many organizations still have difficulty monitoring their projects' progress. Managers frequently want to know: “At which sprint will we finish the project?
With tools like the Burndown and Burnup Charts and the Velocity Graph, we can easily find the answer to this question. However, the most important questions managers should ask are: "Do I really need all the features originally identified?" and "Do I have the budget to complete all the required features?" To answer these questions, we need new tools to identify what part of the scope will be completed at the end of a given sprint.
The Sunset Graph, developed by Pyxis and named for its colors, is the perfect tool to make the following visible:
- The scope of the backlog split into the following categories: mandatory, important, or optional
- The actual progress also split into the following categories: mandatory, important, or optional
- The forecast completion trends based on the team's velocity
- The fluctuation of the scope in the backlog.
The level of importance of work item is determined by their business value.
- WI with business value of 8 and over are mandatory
- WI with business value between 4 and 7 are important
- WI with business value of 3 and below are optional
Here is an example of the Sunset Graph:

As you can see, at the beginning of the project (after sprint 0), the backlog contains 65 points of mandatory stories, 25 points of important stories, and 10 points of optional stories.
At the end of sprint 1, we can see that the optimistic trend (green line) forecasts that the team will complete the mandatory scope around sprint 12 and the complete project scope at sprint 18.
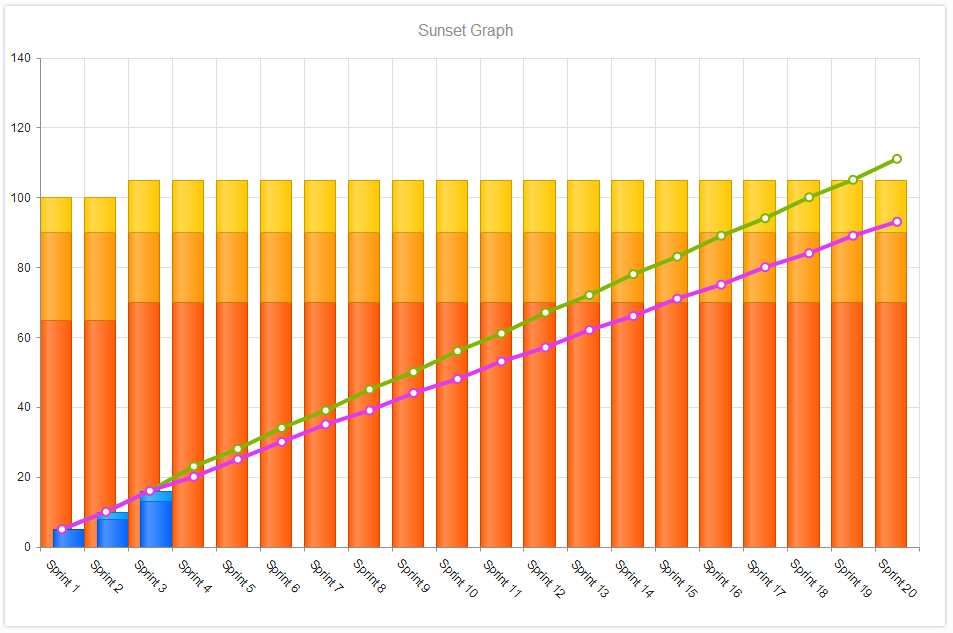
At the end of sprint 3, we can see that a few mandatory stories were added to the backlog. The optimistic trend now shows that the team will finish the mandatory stories near sprint 13 and all the features around sprint 19.
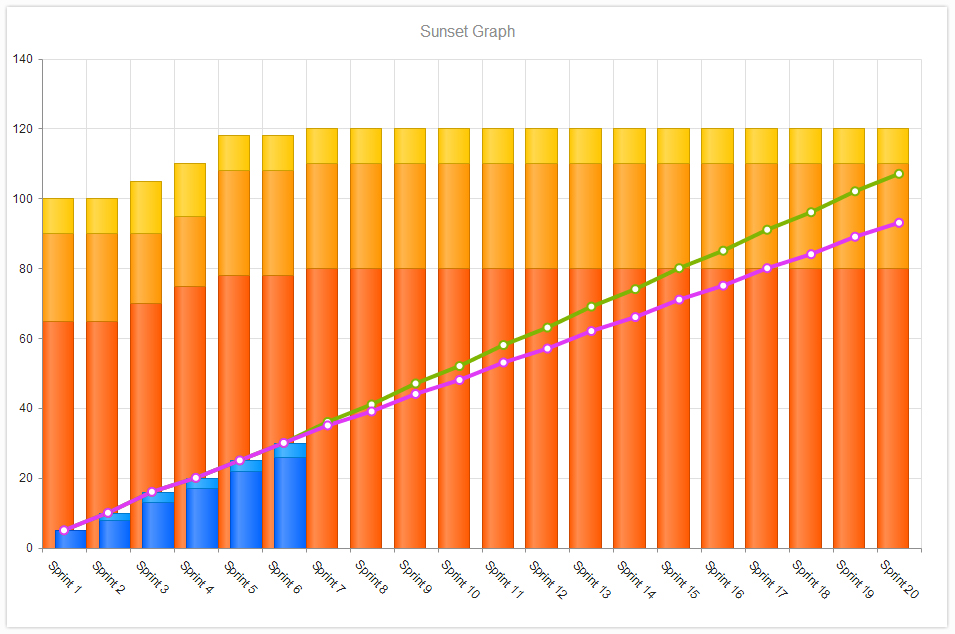
At the end of sprint 6, we can see that the PO is still discovering new mandatory stories that need to be completed in order to achieve the objectives of the project. The optimistic trend reflects the impact of the additional stories on the schedule.
With this information, the PO and managers now have a better understanding of what is happening. Even though the team seems to have a steady velocity, the size of the product backlog keeps increasing. Knowing this, the managers could take the decision to have a backlog grooming or add new developers. They could actually make a variety of improvements. The important thing is that they can see a projection that makes sense and can anticipate: scope creep, scheduling issues, or budget overruns. The visibility from the Sunset Graph gives the team an opportunity to find solutions before time runs out.
Together with the evaluation of the business value and effort on each story, this graph allows:
- the team to become aware of the extent of the backlog and objectives
- the team to verify its velocity, check the accuracy of estimates, and take actions to improve themselves
- the PO to know what to expect and, if necessary, adjust priorities by pulling on the Calendar, Budget, or Scope levers
- the team to understand the project's progress and to forecast when the minimum scope could be completed, but also the potential malfunctions (e.g. fluctuation of the backlog, velocity degradation...).
The important thing to remember is that the purpose of this graph is to encourage discussions between the team, the PO, and managers, so they can find solutions together.
The Sunset Graph is part of the new Dashboard add-on which will be available in the next release, due out tomorrow.